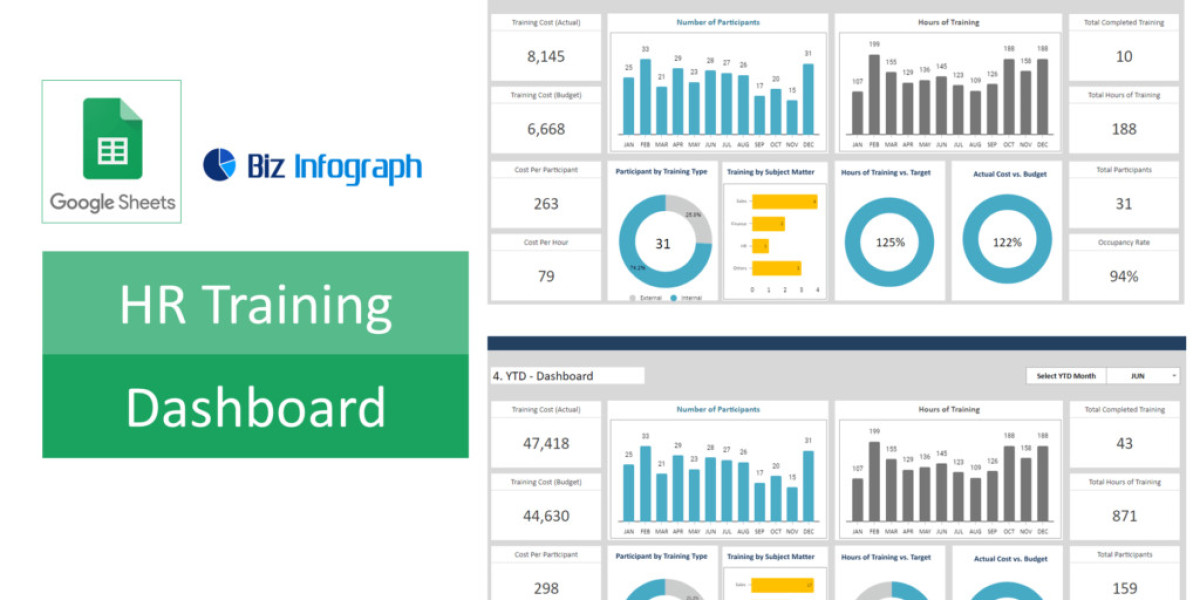
As your organization grows, so does the complexity of its training needs and the data generated from various training initiatives. Utilizing advanced data analysis techniques within your HR Training dashboard can help you uncover deeper insights, predict future training needs, and measure the impact of training on performance. This article explores several advanced techniques that can elevate your dashboard's capabilities, ensuring that your training programs are both effective and aligned with organizational goals.
Predictive Analytics for Future Training Needs
By analyzing historical training data and employee performance metrics, you can start to predict future training needs and skills gaps within your organization.
Trend Analysis: Use Google Sheets functions and charts to identify trends in training participation and completion rates over time. This can help forecast future training demand.
Correlation Analysis: Determine the relationship between training activities and key performance indicators (KPIs) for your organization. This can highlight which types of training have the most significant impact on performance.
Utilizing Machine Learning for Personalized Training Recommendations
Google Sheets can be integrated with Google's AI and machine learning capabilities to provide personalized training recommendations for employees.
Google Cloud AI Platform: By leveraging the Google Cloud AI Platform, you can use machine learning models to analyze your training data and predict which employees might benefit most from specific training programs.
Custom Scripts: Use Google Apps Script to write custom functions that apply basic machine learning algorithms directly within your dashboard. This can automate the process of matching employees with recommended training based on their roles, skills, and performance history.
Sentiment Analysis of Training Feedback
Understanding the qualitative feedback from training participants is crucial for continuous improvement. Sentiment analysis can help you gauge the overall sentiment of the feedback, identifying areas for enhancement.
Integrating NLP Tools: Use natural language processing (NLP) tools available through Google Cloud or other third-party APIs to analyze open-ended feedback within your Google Sheets. This can provide insights into the overall sentiment and highlight common themes or concerns.
Visualizing Feedback Sentiment: Create visual representations of sentiment analysis results in your dashboard, such as word clouds or sentiment scores, to quickly assess feedback trends.
Benchmarking and Comparative Analysis
Benchmarking against industry standards or past performance can offer valuable context for your training data, helping to set realistic targets and measure success.
External Data Integration: Import industry benchmarks or standards into your Google Sheets dashboard to compare your training metrics against external criteria.
Historical Data Comparison: Use your dashboard to compare current training metrics against historical data, identifying areas of improvement or decline.
Automating Anomaly Detection
Identifying outliers or anomalies in your training data can alert you to issues or exceptional achievements that may require further investigation.
Conditional Formatting: Use conditional formatting rules in Google Sheets to automatically highlight data points that fall outside expected ranges, such as unusually high or low completion rates.
Custom Alerts: Write Google Apps Script to analyze your data for anomalies and send automated alerts or emails when unusual patterns are detected.


